Marketing Analytics from a Practitioner’s Lens — Part I
Successful Marketing Analytics leaders apply best practices across seven key capability areas: the source systems that create data; the processes that move data around; the analytical databases and lakes that store data; the data science techniques and approaches to analyze and create insights; the business intelligence tools to expose insights to stakeholders; the organizational approaches to prioritize and deliver great work; and the team capabilities and training necessary to deliver on the jobs-to-be-done.
The Marketing Analytics function is typically asked to do five kinds of jobs. The What job is simplest: counting stimulus (impressions, spend) and response (leads, orders) in report format. This is sometimes called reporting or business intelligence. Building upon the What reports are the questions of Why, Who, How and What’s Next. These questions generate insights, recommendations, profiles, and predictions that help marketers make data-informed decisions.

The WHAT: Business Intelligence and Reporting
In many Marketing Analytics organizations, most analyst time is spent counting and summarizing data. Business intelligence (BI) software is supposed to automate these manual reporting tasks, but for many marketers this has not happened. Instead, analysts juggle Excel spreadsheets, dashboards from other systems, queries of various databases, and files from vendors to put together reports that do one-off reporting tasks. But these analyses are often difficult or impossible to reuse.

“What” reporting should be 80% automated, but several common upstream marketing data problems prevent organizations from reaching this level:
. Information kept in spreadsheets
• Using dashboards as databases
• Non-existent or conflicting metadata
• Constantly changing data streams, particularly from vendors
These upstream data blockers are sometimes given short shrift, as leaders instead focus on “getting something built.” This inevitably results in distrust and poor usage, as numbers fail to match between systems, and data refreshes take months or even quarters.
What reporting is critical for running the business. Understanding progress-to-goal, spend by channel, and last-touch attribution is critical for marketers. The best reporting is visual — but also includes the ability to drill through to detailed, tabular reporting that managers can use to draw their own inferences and conclusions. In some cases, analytics organizations can “hoard the information” for fear of transparency. This should be avoided; it creates bottlenecks and drives resentment.
Generally, the What use case is the first of the five that should be mastered. The “how much, how many” data should be well understood by everyone; this provides a sensical substrate for more advanced questions. It is difficult to productively engage with more advanced questions about attribution, audience dynamics, or predictive modeling if different stakeholders can’t agree on how many leads are being produced, or how much money is being spent by channel.
The WHY: Data Detective Work
Marketing is a dynamic and constantly changing job, and there are always new ad hoc questions emerging from leadership. Answering these questions requires fast access to diverse data sets, alongside a powerful “data munging” toolkit to quickly restructure and join data.
Data detectives are a unique breed. They are naturally impatient to find answers, and seek information from any source they can find. They are then capable of weaving these sources together into a compelling narrative that can be processed by executives.
Data detectives don’t have time to hunt for these data across hard-to-access systems owned by different departments; they need a comprehensive repository of information a “query’s length” away from their development environment. In many marketing organizations, the data required for Why analyses are many emails and meetings away — lengthening the time to get an answer from hours to weeks or even months.
The WHO: Understanding Your Audiences
Segmentation, targeting, and positioning — or “STP” — is part of the foundational marketing curriculum for business students. Understanding prospects and customers is hampered in many marketing analytics organizations because of a poor grasp of identity. Individuals, households, families, business offices, and relationships are hard to represent in data format, particularly when you don’t own the data.
Executives, however, need to know Who their customers are, and which audiences are responding to different offers. Ideally, analysts should be able to link stimulus and response activities and promotions to a robust set of cross-walked identity keys to enrich buyer and customer journeys. However, the reality is that most identities exist in siloes, making truly empathic and actionable marketing extremely difficult.
The HOW: Marketing Effectiveness
The CFO’s biggest question is “how did marketing actually drive the business?” This seems like a simple ask, but it is very complex. Last-touch attribution can be hard enough, but marketing works across channels, and measuring upper-funnel impact is difficult (but not impossible) to fully quantify.
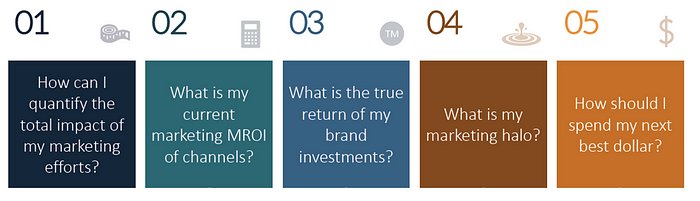
There are five key questions that analysts typically need to answer for executives asking questions about marketing’s worth. The first is simply quantifying marketing’s contribution to the business without double-counting — a formidable challenge in and of itself. After that has been accomplished, channel-by-channel attribution (multi-touch attribution) is a common use case. The less quantifiable aspects of marketing — brand and upper-funnel investments — are harder to measure and usually require an intermediate “attitudinal” variable. Finally, marketing optimization seeks to re-mix channels, audiences, and geographies to drive efficiency and effectiveness.
Measuring marketing effectiveness at any level depends on quality data, and code-based, version-controlled tools through which models can be built, deployed, and tweaked at a high cadence to deliver timely answers in a constantly changing environment.
What’s Upcoming: Predicting the Future
Crystal balls are sadly still not available, but machine learning techniques — combined with vast quantities of data — give marketers the ability to create models of people and events that help to predict behavior. The most common types of machine learning models for marketers are propensity models.
Propensity models output the probability that an individual, household, customer, or business will do something — usually, respond to marketing or make a purchase. To build and deploy machine learning models at scale, millions of rows of individual-level records — along with complete promotional histories and as many predictive features as possible — are required
In the next part we will discuss in detail about the 7 building blocks of Marketing Analytics:
- Source Systems: Long-term vision/commitment to standardizing marketing tech
- Data Pipelines: High-quality and reproducible
- Analytical Data Storage: Exhaustive, organized, high-speed, and accessible
- Data Science: Open-source, reproducible, and connected to data
- Business Intelligence: Tools that handle both visualization and tabulation
- Organization: Flexible, clear project management structures
- Skills: Team built around technology-capable, marketing-expert doers
Please follow and comment your thoughts. See you in part-II